
Summary
- Mean, Median, Mode are three principle measures of location. In general, these will not all give the same numerical value for a given dataset/distribution.
- Mean is defined by the formula:
.
- Mode is the most frequently occuring number.
- Range is the largest number minus the smallest number.
- Median is the middle number of an ordered set given by the formula:
Average can be described as the number that gives us a sense of a central tendency, or a number that is more representative of a set. There are number of ways in which you can measure the central tendency, or a average of a set of numbers. The four basic ones are Mean, Median, Mode and Range.
Mean
Mean is the most frequent measure of central tendency, which is simply the ‘average’ of that data.
In everyday life when someone asks you to take out the average of a set of numbers, they want you to do is to figure out the mean and not median, mode or range. To do that you add the numbers in the set and then divide it by the total number of numbers in the set. Take a look at this simple example to make things more clearer.
Say we have a set of:
[32, 28, 67, 39, 19]
And we are asked to find the mean of the this data.
We add all the numbers together and divide it by the total number of numbers.
In this case it will be:

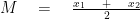
We can thus say that the formula for the mean is:
(Where 
We also use the group data to compute particular descriptive statistics, specifically the mean. In which we perform the appropriate calculations by groups.
Example #1
| Class interval | Midpoint | Frequency | fx |  |
| 120 - 130 | 125 | 1 | 125 | 15625 |
| 130 - 140 | 135 | 4 | 540 | 72900 |
| 140 - 150 | 145 | 5 | 725 | 105125 |
| 150 - 160 | 155 | 6 | 930 | 144150 |
| 160 - 170 | 165 | 7 | 1155 | 190575 |
| 170 - 180 | 175 | 5 | 875 | 153152 |
| 180 - 190 | 185 | 1 | 185 | 34225 |
| Total, | 29 | 4535 | 715725 |
Hence , the grouped mean is :

Median
Another method for measuring the average, is by finding the middle value of an (ascending) ordered set.
In other words, putting all the numbers in order from the lowest to the highest and taking the middle number is known as median.
So let’s take a look at its example.
Say you have a set of numbers:
[32, 28, 67, 39, 19]
So, for this data set n = 5
We put all the numbers in order from the lowest to the highest:
[19, 28, 32, 39, 67]
Take the middle value, which in this case is an explicit value, so the average of this would be 32.
However if you have a set of numbers where n is an even number in that case we take average of the values either side of the ‘midpoint’
Hence:
Example #2
[19, 24, 28, 32, 32, 37, 39, 44, 48]
After putting them order we will take the two middle values, add them together and then divide by 2.

Similarly, if we have a grouped data, in that case the value median is determined by the following formula:
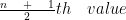
From the previous example we know that our n was 10 so putting it in the formula we get:

By 5.5 we know that there is no explicit value, so from our ordered dataset we take the 5th and the 6th value which are 32 and 37 and put it into the midpoint formula to find our answer.
Another way we might have to find median is through histograms. If you look at the example below you can see that the highest column is 25, put it in our formula for grouped data:

 This is the median
Range
To find the range of a set of data, all you have to do is minus the smallest number in the set by the largest number in the set.
Example #3
The Jaeger family drove through 6 midwestern states on their summer vacation. Gasoline prices varied from state to state. What is the range of gasoline prices?
[$1.79, $1.61, $1.96, $2.09, $1.84, $1.75]
First of all we have to sort the data out into an ascending order, from the greatest to smallest, so we get:
[$1.61, $1.75, $1.79, $1.84, $1.96, $2.09]
Then we take the highest number which is 2.09 and minus it from the smallest number which is 1.61 to find the range:
$2.09 – $1.61 = $0.48
Mode
The mode of a data set is the number that occurs most frequently in the set. To easily find the mode, put the numbers in order from least to greatest and count how many times each number occurs.
The number that occurs the most is the mode.
Example:
[2, 5, 5, 7, 7, 7, 8, 8, 9]
since 7 is the most occuring number in this dataset, that will be the mode.
Similarly , on a histogram, in order to find the mode you just have to see which class division is the tallest. Like the in the example below, you can see the the tallest interval is 4, so the mode will be 4.
