
Summary
- Regression line helps us connect two or more variables together, its equation is y = ax + b
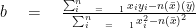
- To find the value of b we use the following formula:
- An explanatory variable is an Independent variable
- Response variable is a Dependent variable
Regression is commonly known for data analysis and It helps us understand the connection between two (dependant and independant) or more variables with a linear equation. When dealing with paired data, we draw a scatter diagram and study the graph to inspect any relationship between the two variables.
Example#1
Q.
| 1 | 2 | 3 | 4 | 5 | 6 | 7 | 8 | |
| height | 65 | 64 | 62 | 69 | 67 | 65 | 61 | 67 |
| weight | 105 | 115 | 110 | 140 | 120 | 135 | 104 | 130 |
We have been given data of students from school with height and weight, we will first draw the scatter diagram for this data. We will take height on X axis since it is an independent variable and weight on Y axis since weight is a dependant variable and draw the graph. We can see that both the variable height and weight have a positive linear relation.

After drawing the scatter diagram. We will now join the points and draw a best fit line which will have the maximum points on it. We also need to remember that the best fit line should also pass through the mean point. Which in this case is (65, 120).

Another way of finding the regression line is by using the least square regression line formula. By using this formula we make sure that our line is accurate and not just drawn by estimating the points. Regression line equation is as follows for y on x.
y = ax + b
Where a = y – intercept
Also the initial value of y
b = gradient
Also the change in y when we increase the value of x by 1 unit
Inorder to find b on the regression equation we will use the following formula:
We are also sometimes asked which of the two X OR Y is the explanatory variable and which is a response variable.
An explanatory variable is defined as an independent variable, whose value does not get affected by the any other variable.
On the other hand, response variable is defined as a dependent variable, which depends upon the other variables.
Example #2
Q. We are given the loss a company goes through in 10 weeks as its increases the number of workers each week.
a) find the regression line
b) figure out the dependent and independent variable
c) If the company has 20 workers find out the loss it goes through
| Weeks | number of workers (xi) | loss (yi) |
|---|---|---|
| 1 | 9 | 420 |
| 2 | 11 | 350 |
| 3 | 12 | 360 |
| 4 | 13 | 300 |
| 5 | 15 | 225 |
| 6 | 18 | 200 |
| 7 | 16 | 230 |
| 8 | 14 | 280 |
| 9 | 12 | 315 |
| 10 | 10 | 410 |
| Total = 130 | Total = 3090 |
a) Firstly, we will make two other columns xy and 
| Weeks | number of workers (xi) | loss (yi) | xy | |
|---|---|---|---|---|
| 1 | 9 | 420 | 3780 | 81 |
| 2 | 11 | 350 | 3850 | 121 |
| 3 | 12 | 360 | 4320 | 144 |
| 4 | 13 | 300 | 3900 | 169 |
| 5 | 15 | 225 | 3375 | 225 |
| 6 | 18 | 200 | 3600 | 324 |
| 7 | 16 | 230 | 3680 | 256 |
| 8 | 14 | 280 | 3920 | 196 |
| 9 | 12 | 315 | 3780 | 144 |
| 10 | 10 | 410 | 4100 | 100 |
| Total = 130 | Total = 3090 |
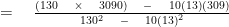
Next we would need to calculate “b” by substituting values from above in the given formula of b.
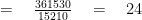
In order to find “a” in our equation we use both the mean of y and x, thus we will have the following equation:


Now putting all the information in equation we can calculate the value of “a” :
309 = a(13) + 24
a = 21.92

We now, represent all this information on the initial line of regression equation as:
y = 22x + 24
b) We know that from the information above, the independent variable is the explanatory variable whereas the dependent variable is the response variable.
Since the loss dependents upon the number of workers we can say that loss is the dependent variable.
However, since the number of workers do not depend upon the loss, we can say that the number of workers are the independent variable.
c) Now that we have our regression line we can find the loss of the company. We do this as as we know that the number of workers(x) are 20, thus putting it in the equation we get:
y = 22(20) + 24
y = 464
Reference
- J.S abdey statistics 1