
Statistics is the branch of mathematics used to collect, analyze, interpret, and present data. The purpose of studying statistics is to be able to develop critical and analytic thinking skills.
Statistics is further divided into two branches:
- Descriptive statistics: It deals with describing a set of data graphically
- Inference statistics: This obtains information about a large set of data or future outcomes from a smaller sample
Statistics is closely linked to probability theory. We can use statistics to work out probabilities, Probability basically tells us about a chance, that a certain event will occur.
Moving on, as far as advanced level statistics is concerned, we will go through both these branches mentioned above. The topics we will cover in the statistics revision articles are:
Topics and Brief description
Averages
Average can be described as the number that gives us a sense of a central tendency, or a number that is more representative of a set.
Skewness
Skewness measures the departure from symmetry.
- If the mean > median it indicates that the distribution is positively skewed.
- If the mean is < median it indicates that the distribution is negatively skewed.
Box & Whisker diagrams
A box and whiskers diagram is also known as box plot, it displays a summary of a set of data. Minimum, maximum, median, first quartile and third quartile, interquartile, upper limit and lower limit.
Permutations & Combinations
Both permutations and combinations are groups or arrangements of objects. With combinations, the order of the objects is insignificant, whereas in permutations the order of the objects makes a difference.
Probability

It is a measure of the likelihood that an event will happen.
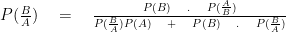
Bayes Theorem
Linear regression
Regression line helps us connect two or more variables together, its equation is y = ax + b.
Product moment correlation coefficient
Formula for correlation:

Measures of dispersion
Measures the fluctuation/variation that is present in the data.
Expectation & variance
Expected value of a random variable:

Var(X), is defined by:

Discrete random variables
Discrete random variable are random variable that can take on distinct and separate variable.
Normal distribution
The normal distribution is a theoretical distribution of values.

Central limit theorem
The Central Limit Theorem (CLT) basically tells us that the sampling distribution of the sample mean is, at least approximately, normally distributed.
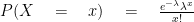
Poisson distribution
The probability function of the poisson distribution is:
Uniform distribution
In uniform distribution we should know that random variable is a continuous random variable. Probability density function f(x) to give 
Binomial distribution
The formula for binomial distribution is as follows:

Geometric distribution
The geometric distribution are the trails needed to get the first success in repeated and independent binomial trial.

Histograms & Cumulative frequency
A histogram show the distribution of numerical data. Cumulative frequency is accumulation of the frequencies
Discrete uniform distribution
The values of a discrete random variable are obtained by counting, thus making it known as countable. Uniform distribution simply means that when all of the random variable occur with equal probability.
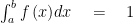
Continuous random variables
If [a, b] are the domain of the continuous random variable function f and f(x) > 0 then:
Normal approximations
A normal approximation can be defined as a process where the shape of the binomial distribution is estimated by using the normal curve.
One & two tailed tests
A one-tailed test is a statistical test in which the critical area of a distribution is one-sided so that it is either greater than or less than a certain value, but not both.
Sampling
Sampling is the selection of a subset of individuals from within a statistical population to estimate characteristics of the whole population.
Estimators
It is a rule, method, or criterion for arriving at an estimate of the value of a parameter.
Confidence intervals
A confidence interval is a range of values we are fairly sure our true value lies in.
Hypothesis testing
Hypothesis testing is an act in statistics whereby an analyst tests an assumption regarding a population parameter.
Random samples
Random samples is known as the collection of independent and identically distributed random variables such as 
Reference
- https://en.wikipedia.org/wiki/Sampling_(statistics)
- https://www.investopedia.com/terms/o/one-tailed-test.asp
- https://studymoose.com/intro-to-statistics-essay
- http://www.mathscareers.org.uk/article/statistics-probability/
- http://lsc.cornell.edu/wp-content/uploads/2016/01/Why-study-statistics.pdf
- https://www.chegg.com/homework-help/definitions/normal-approximation-31