
Summary
- Formula for correlation
- r >0 positive correlation
- r <0 negative correlation
- r =0 no/zero correlation
- r =+1 r = -1 perfect positive and negative correlation respectively
- A good relation between the variables means that the line of best fit will pass through maximum points

The interdependence of the two variables is known as as correlation.correlation is measured by coefficient of correlation which is denoted by ”r”. And its numerical value ranges from +1 to -1.
It also helps us understand the strength of the relationship and whether the relationship between two variables is positive or negative.
Formula for correlation:

Positive correlation:
- Is when both the variables have the same type of moment and they both rise or fall together in the same direction
- E.g sale of ice cream with change in temperature, if the temperature increases more ice cream is sold and as the temperature decreases less ice cream is sold
- The expenditure of a family depends on their income. If income falls the expenditure also falls and vice versa.

Negative correlation:
- When both the variables move in different direction. They are considered to have an inverse relationship
- E.g when you start exercising your weight reduces significantly
- As the price of one product increases its demand falls and as its price decreases its demand increases.

If the correlation is found to be 0
Then in that case, both the variables X and Y are considered independent and are considered to have no linear dependency on each other.
- E.g The price of shoes and jeans have nothing in common, thus if the price of jeans increases or falls it will have no effect on the price of shoes and so we can say that they have zero correlation with each other

If the coefficient of correlation is -1
It is considered a perfect negative correlation and if the correlation is +1 then it is considered a perfect positive correlation. The closer the value is to -1 or +1 the stronger the relationship is considered to be.
Example #1
| Week | 1 | 2 | 3 | 4 | 5 | 6 | 7 | 8 | 9 | 10 |
|---|---|---|---|---|---|---|---|---|---|---|
| x | 9 | 11 | 12 | 13 | 15 | 18 | 16 | 14 | 12 | 10 |
| y | 429 | 350 | 360 | 300 | 225 | 200 | 230 | 280 | 315 | 410 |


a) Find the correlation coefficient.
We will first find the mean of x and y:


Next we will plug in all the values in the formula of correlation coefficient that we studied above,
![r\quad =\quad \frac { 39305\quad -\quad 10(309)(13) }{ \sqrt { \left[ 1760\quad -\quad 10{ (13) }^{ 2 } \right] \left[ 1007750\quad -\quad 10{ (309) }^{ 2 } \right] } } \quad =\quad -0.9688](https://s0.wp.com/latex.php?latex=r%5Cquad+%3D%5Cquad+%5Cfrac+%7B+39305%5Cquad+-%5Cquad+10%28309%29%2813%29+%7D%7B+%5Csqrt+%7B+%5Cleft%5B+1760%5Cquad+-%5Cquad+10%7B+%2813%29+%7D%5E%7B+2+%7D+%5Cright%5D+%5Cleft%5B+1007750%5Cquad+-%5Cquad+10%7B+%28309%29+%7D%5E%7B+2+%7D+%5Cright%5D+%7D+%7D+%5Cquad+%3D%5Cquad+-0.9688&bg=ffffff&fg=000&s=0&c=20201002)
b) Calculate the least square regression line.
Use the formula that we discussed in linear regression chapter to calculate this line.
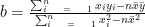

Now plug in the values in the equation below and calculate ”a”.
y = a+bx
309 = a -26.64 (13)
a = 655.56
y = 655.36 – 26.64 x
c) Based on the regression line what will be the predicted loss from the company when there are 17 workers on duty?will you trust this value? Justify your answer.
Since the number of workers is an x variable, we will replace x with 17 the regression equation and calculate the loss to the company.
y = 655.36 – 26.64(17)
y = 202.48
Since the value of y is 202.48 which is not a an outlier. And the correlation coefficient is also close to -1 representing a strong negative correlation. Thus we can say that this value can be trusted.
References
- https://explorable.com/statistical-correlation
- J.S Abdey Statistics 1