
Function
Many people muddle up the concepts of ‘Equation’ and ’Function’. They are related but they are definitely not the same. You will see how. Let us first understand the idea of an ‘Equation’.
An equation is defined as a mathematical relation (involving the ‘=’ symbol) between two or more variables. For instance, the following expression is an equation.
y = 2x + 1
Function is also a relation, but a special one. It is a mathematical relation where each input has one and only one output. You can also consider the function as a mathematical machine that takes a value, does some ‘operation’ on it and then outputs a certain value.

Consider for a moment that you input a value, say 3, into the machine and it outputs one value at one time and another at some other time. It is an unreliable machine, right?
This essentially is the characteristic of a function that it allows only one value as output for an input.
Let us visit some examples. The relation 


Quick Quiz: Which among the following qualify as function(s)?


Now that we have got the gist of what a function is, we can face the technical definition of a function (which makes no sense to students at first). In books, you will find a technical definition of a function as:
“A function is a relation between two sets, X and Y, that assigns each element of the set X exactly one element in the set Y (represented as f: 

Symbolically, a function is usually represented as f(x) (read as ‘f of x’). It can be thought of as ‘f operated on x’. For instance, 
Function is also said to be a mapping of set X to set Y. In other words, Set Y is said to be the image of set X under f.
Domain and Range
Earlier in the definition of the function, two sets X and Y were mentioned. The set X i.e., a set of all possible inputs to the function or the set of values for which the function is defined, is called the Domain of that function. The set Y i.e., a set of corresponding values of output (for given domain), is called the Range of that function. For example, the domain of 


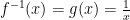
The domain of the function

is set of Real numbers except 0 (at which it is not defined). Its range is set of positive real numbers (square of any real number is always 
Question: What is the domain and range of the function f(x) = 5?
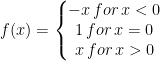
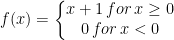
As we have studied that the function is basically a relationship or a rule between two variables (with an extra condition of one output for an input). This rule can also be represented ‘in form of parts or pieces’, i.e., a function can be written in form of two or more parts. Such a function is called piecewise function. An example of a piecewise function is,

Note that it still has to fulfill the condition for being a function. Not all expressions that appear in above form qualify as a function.
Graph of a function
A graph is a very powerful tool. It can convey information that is not visible otherwise. A function can be graphed on a Cartesian coordinate system. There are many ways of plotting a function. We can,
- Make a table of x, y (input, output) points, mark them on a graph paper and join them smoothly.
- Use a plotting tool or software.
Let us develop graphs of some functions. The graph of the function

It should be noted that the elements belonging to the domain of the function are along the 

The graph of 

The modulus function outputs the absolute (positive) value of a given input. Just look at how much information you can extract from this graph. You can see that the minimum value of the function is 0 (at x = 0). Moreover, the domain of the function is the set of Real number (we have the value of function at all values of input). The range of the function is the set of positive real numbers only (since the line never crosses the x – axis towards negative y – axis). Moreover, it can also be seen that the inverse of
The graph of the function 

Can you identify the domain and range of this function by looking at the graph?
Now let us graph a piecewise function:


Note that at x = 0 the value of function is 0 (not 1). We know this by the expression of the piecewise function. To represent such points where a jump is encountered, graphically, a ‘hole’ and a ‘solid point’ are used. For example, in the graph above, a hole has been placed at y = 1, x = 0 to show that the magnitude of the function is not 1 at x = 0. A solid point has been placed at y = 0, x = 0 to emphasize that the magnitude of the function is 0 at x = 0.
Quick quiz: What is the domain and the range of this function (tell by looking at the graph)?
Try to graph the following functions as a practice exercise.
(c = constant)
Vertical line test
A very fascinating fact is presented here. If we have a graph, and we want to know whether the curve on the graph represents a function or not, we can do this by the simple vertical line test. In vertical line test, we observe if the graph intersects any vertical line more than once. If it does intersect more than one time at any value of in the domain, then it is not a function. You may be wondering how does it work?
The vertical line test exploits the basic definition of the function, according to which there should be only one output value for an input. Let us visit two examples on the usage of vertical line test.
Given the graph below, we observe that not a single vertical line will intersect the curve at more than a single point on the curve. Thus, we can immediately conclude that this curve represents a function.

Now, observe the following graph.

It is evident that a vertical line intersects this curve at two points. Therefore, this curve does not represent a function.
Exercise: Plot the equation 
Invertibility of a function
A function 

Finding inverse of a function
Now we will see how to find the inverse of a function. Suppose we are given a function,
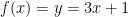
The first thing we do is to write x in terms of y, i.e.,

Now, we swap the symbols (since we use x to represent the input or independent variable). Swapping the symbols gives us the inverse of the function.
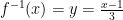
You do not have to worry about it. It looks confusing at first. Take time and try to absorb this procedure of finding the inverse, specifically the swapping of symbols. You will yourself realize why it works this way.
Exercise: Find the inverse of the following functions and check whether the respective inverses also qualify as a function.


Horizontal line test
Since we have understood the concept of invertibility of a function and the vertical line test, we can now benefit from the idea of Horizontal line test. We have just learnt how to find the inverse of a function. It can be realized that we can easily generate the graph of the inverse of a function (or any curve in general) by mirroring the curve along the line y = x. For instance, let us graph

The mirror image is indeed the graph of inverse of
We could also have concluded this directly from the graph of
Continuity of a function
A function is said to be continuous if there is no ‘jump’, ‘hole’ or discontinuity in the graph of the function. It can also be reiterated informally as; a function is said to be continuous if it can be drawn with a pen without lifting it up at any point. Unsurprisingly, a function is said to discontinuous if it is not continuous. For example, the function

As you can see that there is a jump at x = 0 in the graph of unit step function. Therefore, it is not a continuous function (Unit step function is a well-known function and is widely used in many areas of mathematics).
What about piecewise functions? Are they continuous or discontinuous? You might be tempted to think that piecewise functions are always discontinuous. That is not the truth. Reality is that the piecewise function may or may not be continuous (that totally depends). To show this, consider the following two piecewise functions:

The first function is a continuous function whereas the second one is discontinuous (You may graph them to verify).
Transformation of the graph
Graph of a function can be transformed (or modified) in four different ways.
- Translation along y-axis (vertical axis)
- Translation along x-axis (horizontal axis)
- Scaling along the y-axis
- Scaling along the x-axis
Let us illustrate it with the help of an example. Consider the function 

This graph can be shifted (or translated) up or down if we add a positive or negative number on the right-hand side of the expression of function. For instance, if we add -2, we get the following graph.

Similarly, we can translate the graph along the horizontal x-axis by adding a positive or negative number in the input. For instance, 

It is highly recommended to plot the graphs of all aforementioned transformations. Do observe how and in what direction they are transformed (you will find that, for example, if cf(x) stretches the curve along y-axis, f(cx) compresses the curve along x-axis).
Symmetry of a function
Finding symmetry in a function (and the axis of symmetry) is of great significance in mathematics. By now we have observed graphs of several functions. Recall the graph of
Note that shifting the graph along the y-axis does not change its axis of symmetry. For example, the axis of symmetry of 

There are two types of symmetry:
- Even symmetry f(-x) = f(x)
- Odd symmetry f(-x) = -f(x)
It means that we evaluate f(-x) (by putting -x in place of x in the function) and check for the conditions of even or odd symmetry. It is important to note that it is not necessary for a function to possess a symmetry (even or odd) at all.
For example, the function f(x) = x possesses odd symmetry because f(-x) = -x = -f(x). The function 

Exercise: Find and identify the type of symmetry in the following functions:
- Unit step function


By looking at the graphs of the functions, we can immediately tell the type of symmetry in the function. An even function (function with even symmetry) has mirrored image, of its right half plane, along the line x = 0. On the other hand, the odd function has inverted mirrored image, of its right half plane, along the line . You can visualize the graphs of 

Periodicity
It is the property of some functions that they repeat their ‘pattern’ after some finite interval called period. Technically speaking, the smallest value of an independent number T such that 
An example of a periodic function is,

where, n = 0, 1, 2, 3, 4 …
It looks complex at first but it is a simple function. Here is its graph.

You can conclude that its period is . The concept of periodicity is a fundamental idea in mathematics, physics and engineering.
Composite Function
When we write a function as the function of another function i.e., a function of function, the structure is known as a composite function. For example, if we have two functions 


Note that we can write another composite function as

In general, 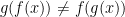

Note that you have to consider 3x + 4 as the input to the function g(x). Thus, 3x + 4 will be replaced by the ‘x’ in g(x) on both sides. Also,

Exercise: Given the functions 

- h(g(x))
- g(h(x))
- h(h(x))
- g(g(x))
Sources:
- https://www.khanacademy.org/math/algebra-home/alg-functions
- https://en.wikipedia.org/wiki/Algebraic_function
- https://tutorial.math.lamar.edu/classes/alg/functiondefn.aspx
- https://revisionmaths.com/advanced-level-maths-revision/pure-maths/algebra/functions
- https://www.cliffsnotes.com/study-guides/algebra/algebra-ii/relations-and-functions/algebra-of-functions
- https://www.mathplanet.com/education/algebra-2/how-to-graph-functions-and-linear-equations/functions-and-linear-equations
- https://study.com/academy/lesson/algebraic-function-definition-examples.html
- https://www.algebra-class.com/algebra-functions.html
- https://byjus.com/jee/functions-and-its-types/
- https://www.quora.com/How-do-I-check-whether-a-function-is-periodic-or-not